Before/after: how to tell whether an effect is real (and the biases that manufacture it)
Mobility gained in 30 seconds, balance improved: surprise, expectation, learned test, regression to the mean. The grid for judging a before/after.
The RNP training space, free for life
Get access to RNP training, no strings attached.
An immediate before/after records the effect of your stimulation, and with it the surprise, the expectation, the warm-up, the learning of the test and the chance in the measurement. To know whether an effect is real, you need a standard stimulus, a blinded measurement, a control condition, several trials and a retest after some delay.
No time? Keep this.
A gain counts if the stimulus and the test are identical before and after, if the person doesn't know what you're hoping for, and if a control condition does clearly worse. It has to exceed the gap your test produces by itself from one trial to the next, and hold at ten minutes, the next day, the following week. Without that, you filmed a passing state. Weeks of programming will tell whether it becomes a lasting gain.
Hello to you, the movement professional,
We, too, have a before/after we were proud of. A test, a short stimulation, a retest, and a clear gap, visible to the naked eye, that we showed more than once. Nobody was cheating, the person was sincere, so were we, and the number had really moved.
With hindsight, one question bothers us: what did it really prove? We see at least four holes in it, the ones in almost every before/after, ours included: the first test serves as a warm-up for the second, the person guesses what we're hoping for, we gladly work the stiffest side, and the next-day measurement almost never exists.
We took apart a textbook example with the tickle that disappears after thirty seconds of pressure under the foot: a real effect, known mechanisms, a duration of a few minutes. The same reading applies to mobility gained in thirty seconds, strength "unlocked" or balance improved. The objection is legitimate: if the number moved, something changed. That's true, the question is what.
What an immediate before/after really measures
In Neuro-Postural Reprogramming, our basic tool remains the test-stimulation-retest cycle: a measurable landmark, a stimulation, a retest. Its weak point comes down to one sentence: the delta measured at retest adds up the effect of the stimulation, if there is one, and everything that changed in the meantime with no connection to it.
Imagine a gap of ten degrees. It may contain one degree of stimulation and nine of everything else, or the reverse, and the number alone doesn't say. For balance, one question even comes before the biases: what your test really measures.
Stimulus, surprise, timing of the measurement: the biases of the procedure
The most ordinary trap: the test afterwards resembles the test before without being identical to it. An instruction changed by one word, a hand placed two centimeters farther away is enough. In the tickle scene, nothing guarantees that the two light touches resemble each other. The first trial often comes as a surprise, the second is expected, and whoever knows what is coming gets ready for it.
The timing of the measurement weighs just as much. A retest taken within the minute lands at the peak of the shortest effects: habituation, for example, fades by itself once the stimulus stops (Rankin et al., 2009). The whole question of the duration of the effect lies there: a single measurement taken early ignores which slope it is on.
That leaves the most underestimated bias: the test repeats itself. A range of motion measured twice in a row can gain on the second trial, tissues warmed up and movement learned. Hopkins (2000) points out that between two consecutive trials, the mean can shift under the effect of learning, motivation or fatigue, and Weir (2005) advises setting aside the trials concerned.
Would a flawless procedure be enough?
Camera, expectations, desirability: the human biases of the before/after
A person tested in front of a practitioner, and even more in front of a phone that is filming, knows what is expected of them. Martin Orne described this mechanism in 1962 under the name demand characteristics: the cues that let the participant guess what is being looked for, and that steer their behavior (Orne, 1962). You ask "and now, is it better?", so she goes a little further and feels steadier because she expects to.
The practitioner has expectations of their own. In 1978, Robert Rosenthal and Donald Rubin gathered 345 studies on interpersonal expectancy effects: what the person measuring expects can steer the responses of the person being measured (Rosenthal and Rubin, 1978). Whoever hopes for a gain risks reading the tool more generously.
On the size of the effect, caution: a systematic review found only seven studies devoted to demand characteristics outside the laboratory, with signs of an effect but data too heterogeneous to quantify it (McCambridge et al., 2012). These biases exist, and nobody knows how much they weigh in your Tuesday session.
Regression to the mean and smallest detectable change
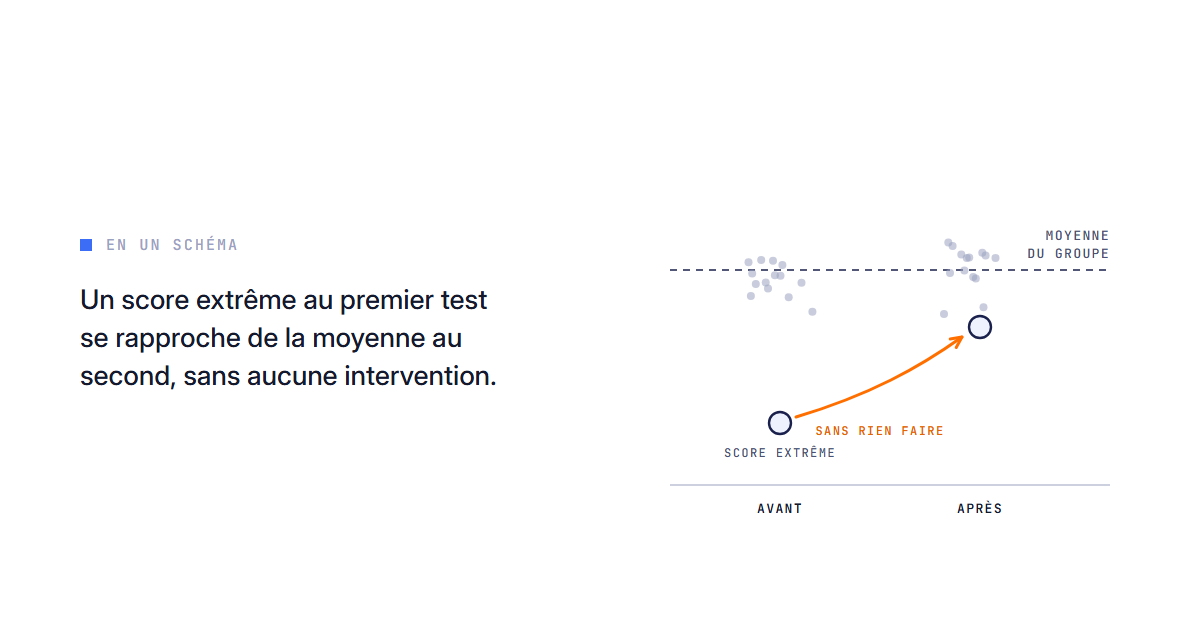
Regression to the mean owes nothing to psychology. If you pick the side, the day or the person whose measurement is the worst, the next measurement has a good chance of being better without anything being done, because an extreme value is rarely followed by an equally extreme value. Barnett, van der Pols and Dobson (2005) write that regression to the mean "can make natural variation in repeated data look like real change", all the more so when the measurement error is large and the selection was made on the starting value. Working the stiffest side is exactly that selection, and we all do it, us first.
Alongside it stands the normal variability of the test. A landmark measured twice in a row never gives the same number, and the same session can leave a fluid result one day, a stiff one the next. Weir (2005) shows how to derive from the measurement error the smallest difference that must be exceeded to claim that an individual has really changed. If your test moves four degrees all by itself, a gain of four degrees tells you nothing.
Biases in a before/after: what they manufacture, how to neutralize them
Bias | What it manufactures | How to neutralize it |
|---|---|---|
Non-standardized stimulus or test | A gap due to the way of measuring | Same instruction, same placement, same operator |
Surprise then expectation | An expected, and therefore prepared, second trial | Trigger without warning |
Timing of the measurement | A gain captured at the peak of a brief effect | Retests at ten minutes, D+1, the following week |
Learning of the test | A gain on the second trial, stimulation or not | Familiarization trials, several measurements |
Demand characteristics | A person who does better to please | Neutral instruction, no camera, condition kept secret |
Practitioner expectation | A more generous reading afterwards | A colleague measures without knowing what was done |
Regression to the mean | The worst side improves by itself | Several baseline measurements, control chosen the same way |
Test variability | A gap within the margin of error | Know the error of your test |
The counter-grid: a test-retest protocol that withstands biases
None of this requires a laboratory. A stimulus and a test written down, always the same. Two or three familiarization trials, then several measurements rather than one. A control condition measured the same way: the same time without stimulation, or the other side, never perfectly neutral. When you can, a colleague who measures without knowing what was done. Then retests at ten minutes, the next day, the following week.
The last word goes to programming. An effect that holds for a week gives a clue; a landmark that progresses over several weeks, measured without stimulation just before, starts to look like a lasting gain. A brilliant session may have taught nobody anything, and it is by redoing the test three weeks later that you know what you built. In the logic of the body in the dark, turning the light back on can be seen within the minute, making it last is read at a distance.
An immediate effect opens a lead, and the proof lies in what holds at retest, built week after week.
Our prediction, which you can check: put through this protocol, your finest before/afters will lose a good part of their gain, one share found again in the control condition, another gone by the next day. If your stimulation keeps a clear gap over the control at D+1 and the following week, beyond the error of your test, you are holding something to program.
What this grid does not settle
It rules out false positives without explaining why an effect exists. Regression to the mean and measurement variability are solidly documented; demand and expectancy effects are documented more unevenly outside the laboratory, and the share of each in a given session remains unknown. An effect that fades at retest may still be useful, a few minutes during which movement is easier to train: a field reading, to be tested like the rest.
Our before/after of old proved one thing: we knew how to make a number move for a few minutes. About the next day, it said nothing.
The number that moves in front of the camera belongs to the session; the one you find again the following week, with nothing stimulated beforehand, finally belongs to the person.
👉 I want to step in at the right place
Frequently asked questions about the before/after
How do you evaluate a before/after reliably?
Standardized stimulus and test, a control condition, several measurements, blinded if possible, retests at ten minutes, D+1 and the following week, and a gain larger than the normal variability of the test.
What is regression to the mean?
An extreme value tends to be followed by a value closer to the mean, which can mimic progress when you intervene on the worst day or side (Barnett et al., 2005).
Does an immediate effect prove anything?
It proves that a state changed at the moment of measurement. It becomes a clue if it survives a retest after some delay, a lasting gain if it holds over weeks of programming.
What if I don't have time to run a control condition?
Measure at least three times before stimulating: you'll see the gap your test produces by itself. Any gain smaller than that gap remains noise.
By the LabO RNP team
LabO RNP is neither a medical nor a paramedical organization. Our approaches add to a care pathway, they never replace it.
References
Barnett AG, van der Pols JC, Dobson AJ. Regression to the mean: what it is and how to deal with it. Int J Epidemiol. 2005;34(1):215-220. doi:10.1093/ije/dyh299. PMID 15333621.
Hopkins WG. Measures of reliability in sports medicine and science. Sports Med. 2000;30(1):1-15. doi:10.2165/00007256-200030010-00001. PMID 10907753.
Weir JP. Quantifying test-retest reliability using the intraclass correlation coefficient and the SEM. J Strength Cond Res. 2005;19(1):231-240. doi:10.1519/15184.1. PMID 15705040.
Orne MT. On the social psychology of the psychological experiment: with particular reference to demand characteristics and their implications. Am Psychol. 1962;17(11):776-783. doi:10.1037/h0043424.
Rosenthal R, Rubin DB. Interpersonal expectancy effects: the first 345 studies. Behav Brain Sci. 1978;1(3):377-386. doi:10.1017/S0140525X00075506.
McCambridge J, de Bruin M, Witton J. The effects of demand characteristics on research participant behaviours in non-laboratory settings: a systematic review. PLoS One. 2012;7(6):e39116. doi:10.1371/journal.pone.0039116. PMID 22723942.
Rankin CH, Abrams T, Barry RJ, et al. Habituation revisited: an updated and revised description of the behavioral characteristics of habituation. Neurobiol Learn Mem. 2009;92(2):135-138. doi:10.1016/j.nlm.2008.09.012. PMID 18854219.
Read next
The RNP from Different Perspectives
Starting from the base or from the task? What the learning pyramid doesn't settle
Bottom-up, top-down: start from the base or from the task? The evidence (CO-OP, Ayres sensory integration) and a logic that marries the two.
Read the article The RNP from Different PerspectivesLearning pyramid and training: performing on a fragile base
Learning pyramid in sport: how an athlete performs on a fragile level, what it costs them and where to place base-level work in the session.
Read the article The RNP from Different PerspectivesCardiac coherence: why six breaths per minute truly change your heart rhythm
Cardiac coherence: why six breaths a minute, the 365 method, what it really does, contraindications. Best read as a trend via your HRV.
Read the articleReady to read the loop before the movement?
The RNP system is meant to be read, targeted and tested from your next assessment. Start with the member space, for free.